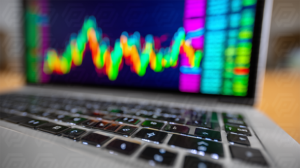
This image captures a close-up of a digital candlestick chart with glowing orange and yellow highlights, representing the fluctuation of stock prices over time. The design is sleek and modern, conveying a high-tech atmosphere that aligns with finance, trading, and investment sectors. With its sharp focus on market activity and data flow, this visual is ideal for use in blog articles, fintech platforms, trading apps, financial newsletters, or corporate presentations related to market analysis, algorithmic trading, or investment strategies. The dynamic composition communicates momentum and volatility, making it highly relevant for conveying economic concepts or market education.
Dynamic Candlestick Chart Showing Stock Price Trends
$1.00
Instant Download
SKU: 025-160216-041825
Categories: Royalty‑Free Images, Business
Tags: abstract, analysis, ar16-9, asset, background, bitcoin, broker, business, candlestick, chart, colorful, crypto, dashboard, data, digital, economic, economy, equity, finance, financial, forex, futuristic, glowing, growth, income, index, innovation, investment, line, liquidity, market, modern, numbers, pattern, portfolio, professional, risk, statistics, stock, success, technology, trade, trading, trend, visual, volatility, wallstreet, wealth
Brand: Paul Peery
Only logged in customers who have purchased this product may leave a review.
Related products
-
Glass Bottle With Blue Liquid And Delicate Wildflowers
Rated 0 out of 5 -
Striped Red And White Drink Container On Beachside Table
Rated 0 out of 5 -
Happy Man Wearing Festive Hoodie With Snowman Print
Rated 0 out of 5 -
Colorful Stock Market Chart Displayed on Laptop Screen
Rated 0 out of 5


Reviews
There are no reviews yet.